

Contextualising Valuations in Indian markets – The Big Picture

Contextualising Valuations in Indian markets – The Big Picture
Harish Krishnan, CFA
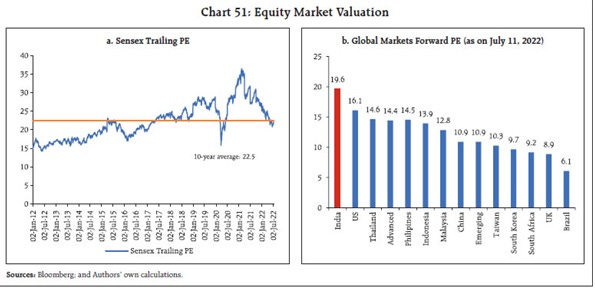
The Reserve Bank of India in its “State of Economy” Report on 16 July 2022, noted the following on Indian equity market valuations:
“The Sensex is trading at a trailing price/earnings ratio (P/E) of 22.0 (as on July 11, 2022), down from 23.7 at end-March 2022, and the ten-year average P/E multiple of 22.5 (Chart 51a). While the index has become inexpensive compared with its valuation in recent years, it remains expensive when compared with emerging market peers (Chart 51b).”
Are Indian valuation therefore in fair value zone (relative to its history) and/or significantly expensive compared to rest of world? What explains India’s valuation premium?
Valuations are an exercise in both numbers and narratives – art and science. Using a calculator to get the P/E ratio (or any similar such heuristic) and then punching buy or sell orders doesn’t work, the context is equally important to gauge. When discussing valuations, there are some common tropes that market participants bring up – liquidity, changing index composition, interest rates etc, We attempt to break these notions and contextualize Indian valuation from another dimension below.
While looking at Sensex/Nifty/MSCI etc, there have been some significant changes in index composition and over the last decade, many cheaper (especially PSU names) have made way for more expensive (consumer/chemical/pharma/consumer discretionary/insurance etc), and thus a common refrain that valuation have crept up only due to such index changes and hence not comparable with past. Besides this, many indices used to have stand-alone P/E ratios and recently moved to consolidated earnings of constituents. To obviate this, we look at Top 1000 listed companies source of data; ICICI Securities, Capitaline) over the last 22 years, computing the consolidated trailing earnings with their market-cap.
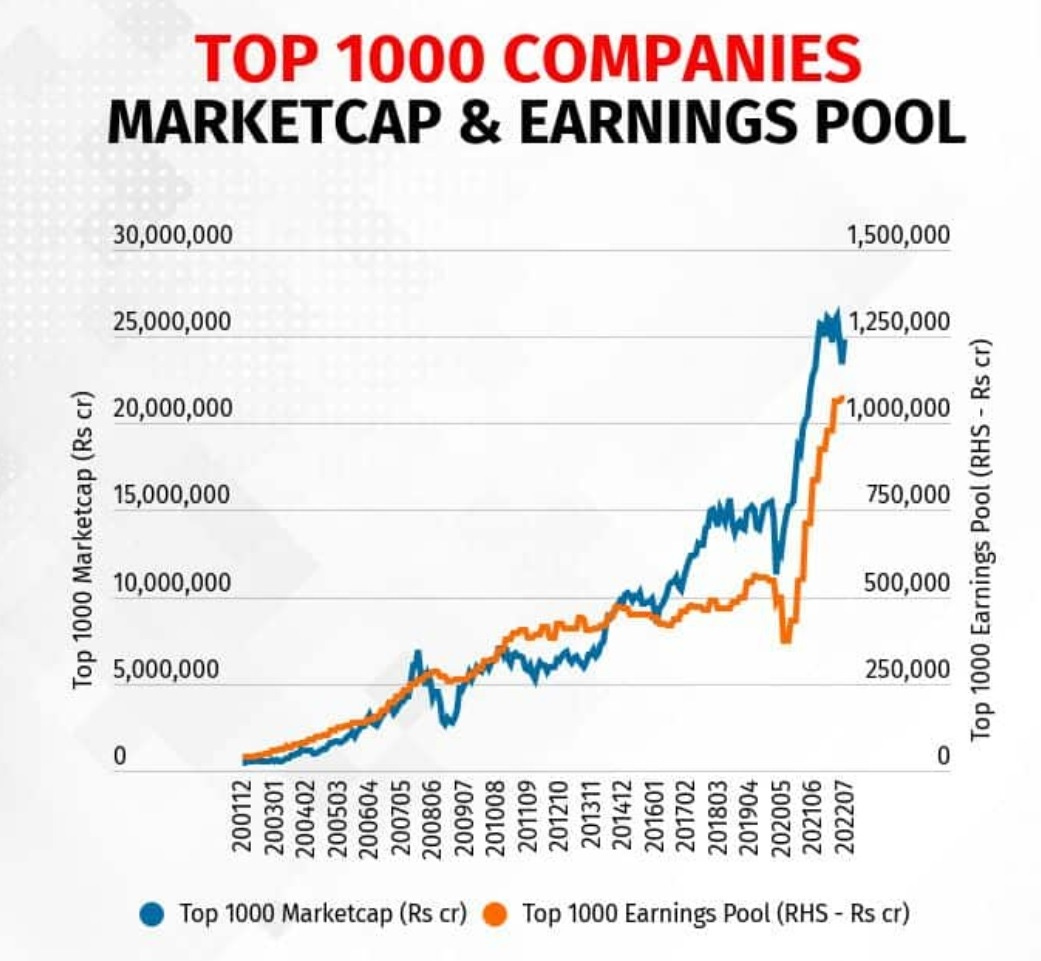
This long-term plot of market-cap and earnings shows that till 2014-15, both were lock-step, but then something snapped post that, due to which marketcap surged significantly higher than profits. These are headline valuation creep that headlines capture, when one looks at markets in aggregate. What explains this surge in valuation ratios?
The culprits are gigantic corporate losses of India Inc, incurred after 2015!
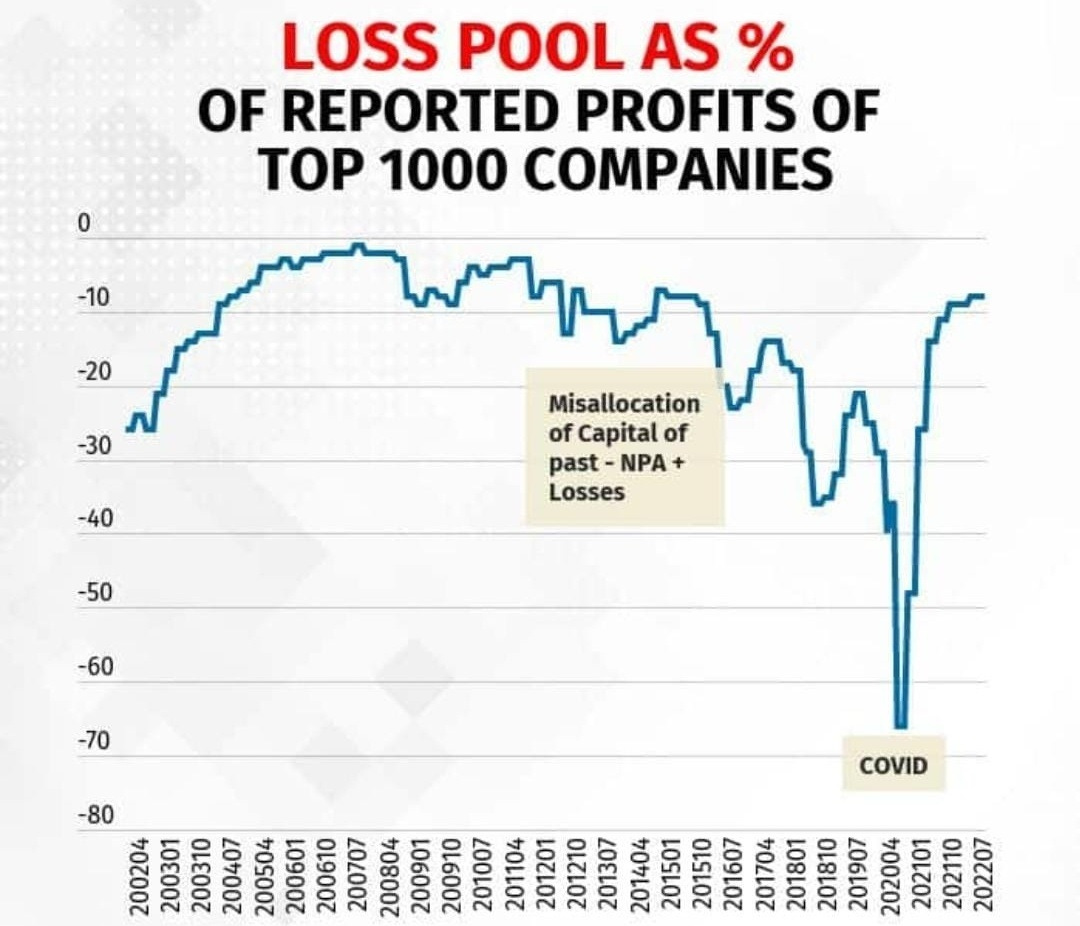
The phase of 2015 to 2019 saw one of most brutal losses declared by India Inc – as both banks as well as corporates reeled under the bad decisions of past – misallocation of capital in grandiose infra projects/ M&A pre GFC took a significant time to wind-down through P&L statements of these companies, as they booked losses. Covid lockdown (June 2020 quarter and to a certain extent, Sep 2020 quarter) saw many companies booking losses as sales dropped sharply due to lockdown – further accentuated the loss pools.
If we plot only the profitable companies’ aggregate market cap and their respective earning pool, we see that lock-step between earnings and market cap broadly holds across the last 22 years. There are certain phases when earning move ahead, while in certain other phases, market moved ahead.

While in pre GFC period, both earnings and market cap went up together, the phase from 2010 to 2013 was a phase where market cap failed to keep up in sync with earnings as worries on macro (fragile 5, policy paralysis) took centre-stage. Markets caught up to earnings post 2014, and then post demonetisation, market cap surged faster than earnings, till covid induced fall in markets. Currently, market cap and earnings pool of these profitable companies are in sync, post the recent correction in markets.
While aggregate marketcap has broadly kept in sync in aggregate profits (of profitable companies), there are obvious pulls and pressure across business cycles across sectors. For eg, a significant improvement in profits in last 2 years have come from metals (an inherently low “PE” sector), and so theoretically, the PE profile of rest of sectors would have gone up. Each sector goes through their own cycles, and hence it is hard to see cyclically adjusted multiple as a snapshot. More so, for a cyclical company, high P/E may be signal to buy while low P/E is possibly an indicator of earnings cycle topping out. To disaggregate the earnings pool, we divided the companies into 4 cohorts:
· Business Compounders – These are sectors, generally which have been less cyclical and have seen lower earnings volatility, while growing their overall earning. IT, FMCG, Financial Services and Private Banks make up this cohort
· Global cyclicals – These are sectors which are shaped by global price trends. Metals, materials, Energy and Trading sectors make up this cohort
· Domestic cyclicals – These are sectors shaped by domestic demand, which are more cyclical. Auto, consumer discretionary, Property, PSU Banks, Cement, Transportation, Industrials, Infrastructure, Media – make up this cohort
· Utility Plays – Telecom and power utilities make up this cohort.
Plotting the market cap share, earnings share of these cohorts reveal how they have moved over the last 2+ decades.
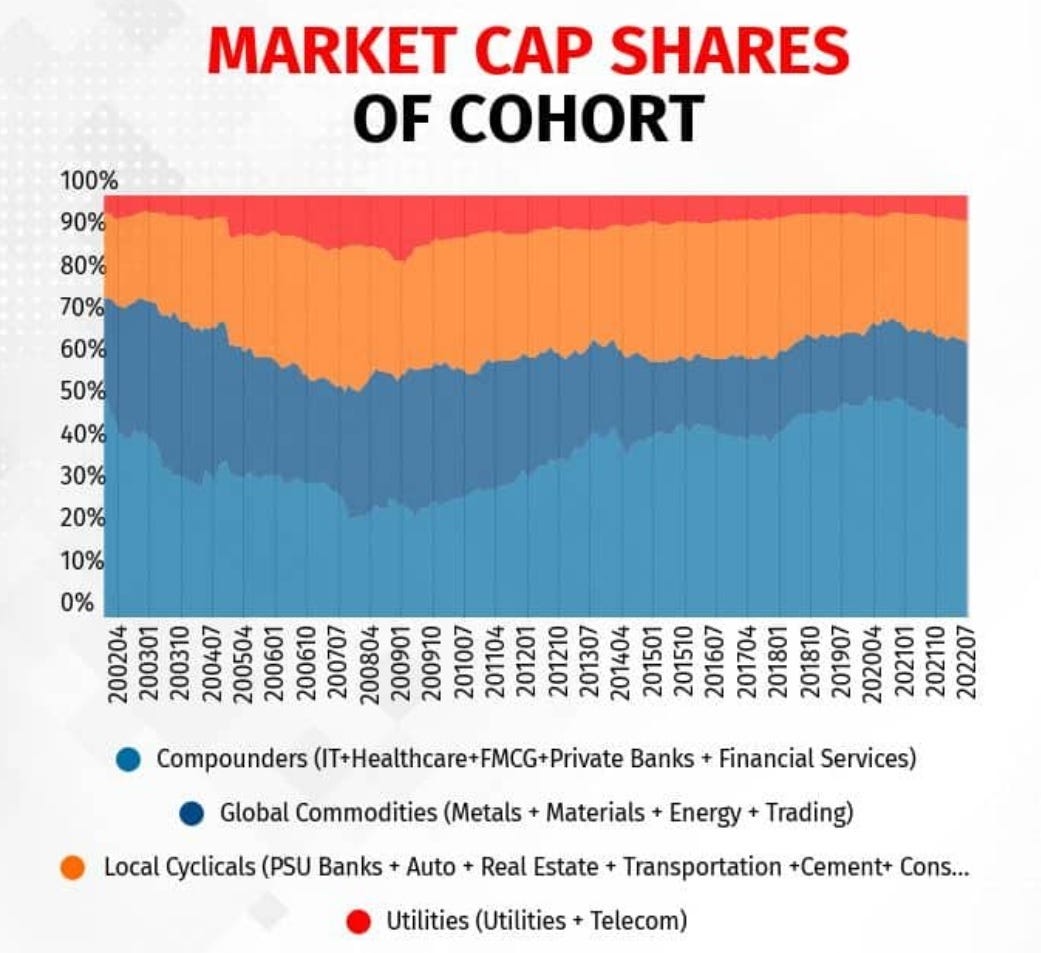
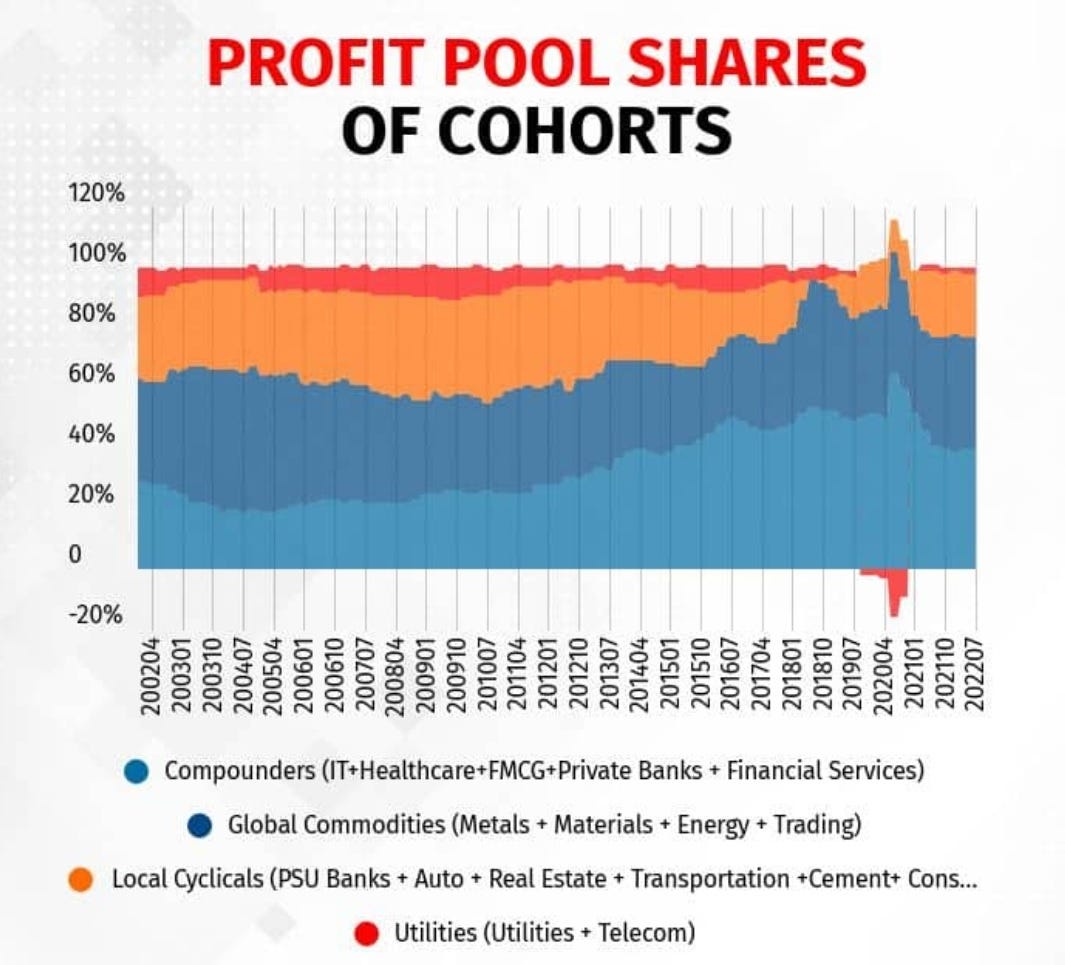
And if we plot the difference in shares, we get a sense which cohorts have re-rated and de-rated.
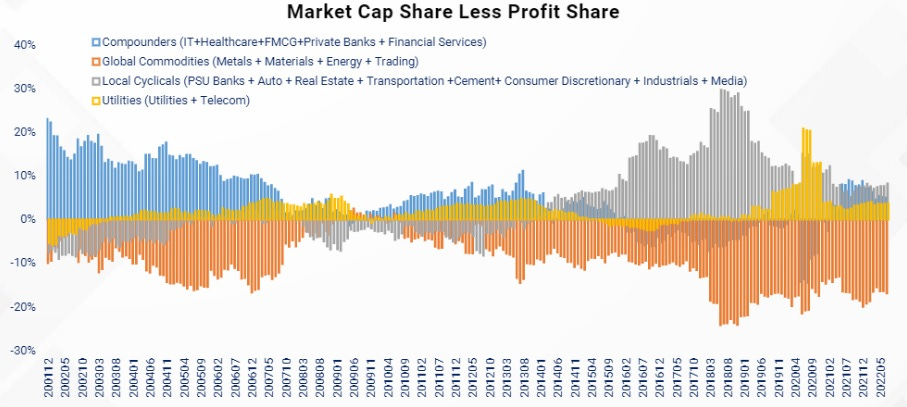
As seen above, the big divergence is Global Commodities and Local Cyclicals. Local cyclicals have re-rated significantly – as earnings in key sectors like auto, property, infrastructure, corporate banks, industrials have been sluggish. The table below shows where few of the sectors have been from earnings cycle point of view.
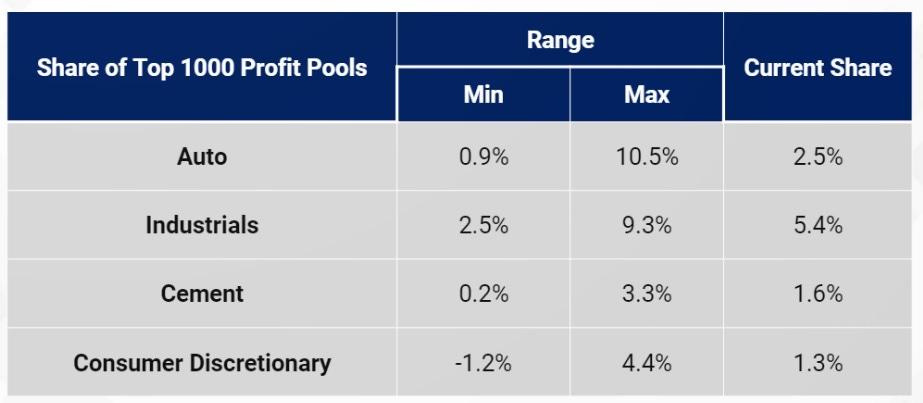
Most of these sectors are at cyclically depressed earnings, and while it may be debatable if previous historical range of earnings may come in future, markets seem to be seeing through low earning phase of many of these sectors. We have seen in the past, for instance when even private banks were ging through increased provisions, P/E for those banks were higher than now, as NPA cycle has reversed over the last few years. Possibly, many of these sectors will see de-rating as earnings come through.
On the other hand, sectors with global cyclical linkages have de-rated, possibly market implying that earnings cycles are not sustainable or global demand will be challenged for such sectors, going ahead. When we look at many international markets, barring a few, most are geared towards global cyclicals. Perhaps, this contextualises the range of P/E ratios, many of those markets trade, due to which many of them appear to be relatively cheap to Indian markets
Are markets right in their assessment of Indian earnings cycle – only time will tell!
(Published in Moneycontrol Pro: