In the previous article (https://hktg13.substack.com/p/unlocking-state-economic-activity), we chronicled India’s economic journey over last 60 years, through the prism of GDP share over time. While there were many sceptics then of India’s improving economic prospects, the pendulum has swung. Multiple reforms, healthy corporate and household balance sheets, significant productivity boosters of infrastructure rollout, digital stack and young population all point to continued ascendancy of Indian economy.
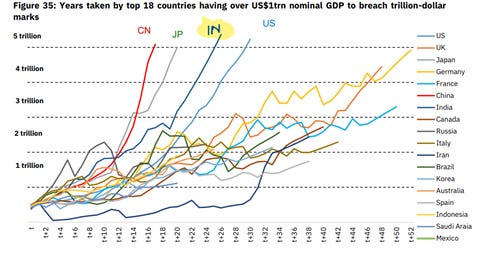
NSE in its monthly report (Pulse, Dec 2022: https://www.nseindia.com/resources/publications-nse-market-pulse) cited IMF World Economic Outlook estimates in this interesting chart. The chart below showcases the economic journey of various countries after they crossed trillion dollars, and time taken for the next few trillion dollars. There are 4 countries (which I have added as legend at the top) – China, Japan, India and US, whose economic growth (slope) make for interesting comparisons.
Firstly, there is just no comparisons for economic growth achieved by China and Japan. In many cases, trillion dollars were added annually! Coming to India and US, per IMF projections, Indian slope is expected to be faster than US, when it transited from 1tn$ to 5tn$+. Effectively to do better than US, nominal GDP growth rates for India over the next few years (say till 2030) need to be in region of 9-12% CAGR.
What does this mean for stocks? For sure, many of you may have received messages, which herald and link the economic growth to stock returns. I quote from one of the messages in twitter –
“Historically, the mother of all bull markets in any nation starts between 2tn$ to 5tn$” - along with charts of Dow Jones (US), Hang Seng(China), Nikkei (Japan) all going up multiple times, during their respective “mother of all bull runs”.
Is this assertion right? Let data speak for itself?
Let’s start with mother-ship of financial markets – US, looking at S&P500. Data of GDP, marketcap to GDP is from World Bank, and index data (just price returns) taken from Bloomberg for each of the 4 countries.
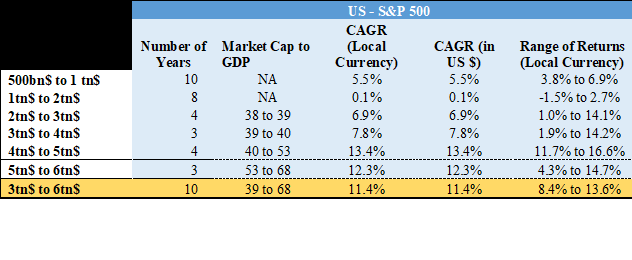
US was the first country to cross 500bn$ nominal GDP in 1959 and crossed 6tn$ in 1991. Post WW2, ravaged by high inflation of 70s, and then subsequent fall in interest rates and pioneering technological innovations– US markets had a steady performance, with returns stepping up as US crossed 3tn$ to 6tn$. CAGR returns (in local returns or in US$ terms, same in this case) are computed using average price of years when it crossed various milestones. Obviously, these are just one instance of returns, so have also computed the range of returns – assuming one got the lowest/highest entry price and exit price of the year. Thus, the entire range of returns for investors, who may come in and exit at different points of time during the course of the year is computed.
Since, the analysis is on GDP at various milestones, one proxy of valuation is marketcap to GDP. There are many issues of using something as simplistic as marketcap to GDP alone (for example, companies are increasingly having greater global revenues, or fact that new listings are not captured in this metric, and as and when they list, there can be upward creep in this ratio etc). Despite these and many other issues, have plotted this ratio at various milestones, to gauge broad temperature of valuations.
In this case, marketcap to GDP has seen a slight improvement, thus equity returns got the benefit of both earnings delivery as well as some re-rating of multiples, as US transited from 3tn$ to 6tn$.
Moving to Japan – the rise of phoenix!
Having been humiliated in WW2, Japan industry picked up its pieces and chronicled one of the most astonishing sprints – by late 80s, there were reports that Japan would even displace US as the most dominant economy. Japan transited from 500bn$ in 1975 and finally crossed 6tn$ in 2011 (and subsequently has fallen to 5tn$ in last few years.)
While economy galloped, experience of equity investors in Japanese equities were mixed.
For investors in Japanese equities, the golden period was when it crossed 500bn$ to 3tn$, subsequent milestones of 3-6tn$ GDP were disappointing for Japanese and international investors investing in Japan. The starting valuations of 123 (marketcap to GDP) plays a spoiler as valuation de-rated significantly along with significant capital misallocation by Corporate Japan in its glorious decades of 70s and 80s. By now, every equity investor must have heard the cautionary tale about Japan – being one of few examples where buy and hold has failed for multiple decades (highs in 1989 still not yet taken out!).
Coming to China – scorching pace of economic growth has not translated to returns for their investors. 30 years of zero returns of MSCI China (till recently) points to the fact that economic growth alone need not translate to returns. China went from 500bn$ in 1994 and crossed 6tn$ in 2010.
China was transiting 3-6tn$ coinciding with GFC (2007 to 2010), returns in that context are more driven by global risk sentiment. This is seen as range of returns (in each of the transitions, the range of returns varies from significant negative to significant positive). This is seen subsequently in last decade as well, where drawdown of 30-40% are an annual feature. Therefore, not only are structural returns (for say buy and hold allocations) not been rewarded, one has to be an astute trader to get call right on investing in China in last decade.
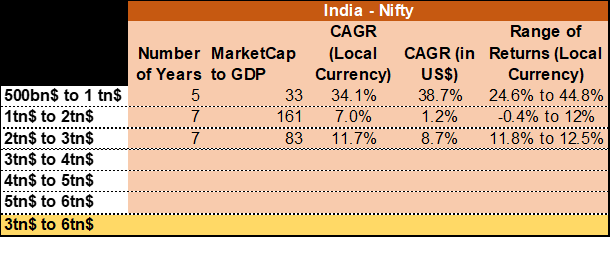
Finally, the Indian experience so far: India broke into 500bn$ club in 2002, at start of great bull-run of this millennium. Starting valuations of marketcap to GDP were 33. This transition generated significant returns for local and international investors – both earnings delivered and valuations re-rated. The next trillion $ transition netted “sub-par” returns, however, given starting valuations, it was still an amazing outcome, especially when seen in context of countries like Japan, China, where starting valuations of 100+ have broadly netted significant negative returns. We exited 2tn$ coinciding with 2014 elections, and to a significant extent, the returns from 2013 Aug to 2014 end helped overall returns during this phase. The next trillion$ milestone saw a reasonable low double digit returns, with low volatility (look at the range of returns), as India continued significant reforms, and scarcity of growth elsewhere.
Thus, to sum up, there is no magical correlation between economy hitting various GDP milestones and equity returns. For sure, we need faster and sustained economic growth to help improve our economic conditions, provide resources to those in need, build out infrastructure and defense spends, and gain significant power in our negotiations globally. Our current market cap to trailing GDP is close to 100%. The ask rate from equities is quite high, and while the expectations can be met (and maybe even surpassed easily), it is only prudent to not blindly go with GDP milestones and believing in “mother of bull markets” etc.
As Warren Buffett quipped in one of his interactions –
“What is the secret of successful marriage? It is not the looks, the money, the intelligence, or anything else. The secret to marriage is low expectations.”
Investors may do well to heed his advice on investing as well, moderate expectations, asset allocate across assets and when chips are down – believe at that time, the great Indian economic journey and where it is potentially headed over the next few decades!
Happy 2023! Happy investing!


quite brilliant