As Nifty breached its previous high, media outlets screamed All Time High (ATH) celebrating the milestone, while rejoicing every up-tick of the market. While there are few Indians that have reasonably invested in equities and therefore enjoy the celebrations as their wealth soars to new highs, for most Indians, this is the quintessential questions in their minds – With markets at All Time High (ATH), should I invest now?
Invariably, investors mind race towards the experience of investing at 2007-08 peak and how investing at ATH lead to significant erosion in their wealth and long wait time to recover? And while it is important to gauge extreme outcomes while parting with one’s money, it is equally important to see range of experiences, investors have experienced while investing at ATH in the past.
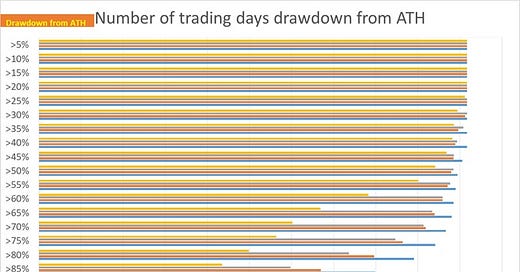
As shown above, there are close to 500 trading days when markets were at All Time Highs, and close to 1000 trading days (out of 5000 odd trading days between 2005 to 2023) when Nifty TR was less than 1% away from ATH (ie. 99% of ATH prices) – not a small amount of days to celebrate. Almost 50% of trading days, (close to 2400 trading days, Nifty TR has been 95% (or better) of ATH.(i.e drawdown of less than 5% from respective ATH). It goes without saying that investing at ATH does involve prospects of drawdown, but atleast for Nifty TR, such drawdowns in last 17 odd years have generally been mostly shallow barring a few exceptions.
However, as one goes down the marketcap curve, the prospect of higher intensity drawdown increases. For example, for almost 50% of trading days, smallcap index drawdown from their respective ATH have been upto 25% (compared to NiftyTR, where 50% of trading days, NiftyTR has been around 5% from its respective ATHs).
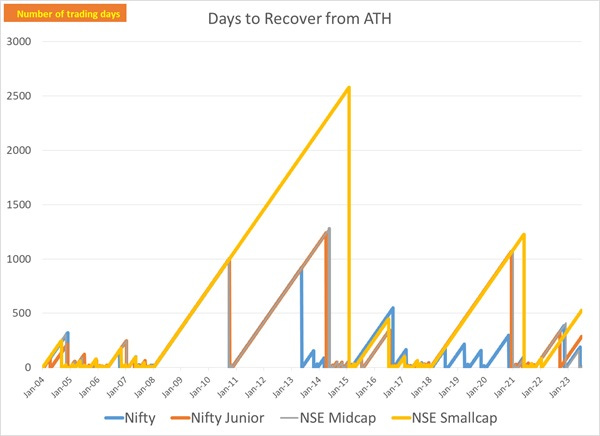
While these have been range of experiences in terms of drawdown from ATH for various indices, what also matters to the investor is number of days, it takes to recover from a drawdown, to get back to ATH. In a sense, this is the opportunity cost for investor, as most investor use FD rates as a reference rate and FD rate move up linearly, and are ATH every day, much like one’s age.
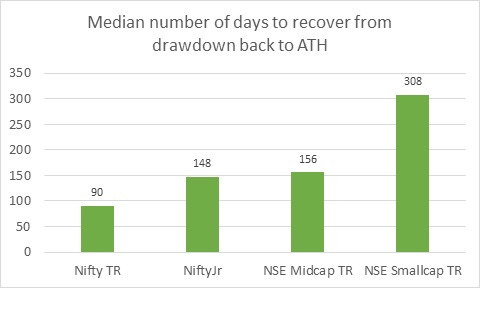
While drawdown in 2007-08 was indeed the nastiest experience, post then, drawdowns have been more palatable (atleast for Nifty). For indices like Nifty, most drawdown have been very shallow, and median number of days, Nifty TR has taken to recover from a drawdown is 90 trading days. However, as one goes below the marketcap curve, the median number of days to recover keeps moving up. For NSE Smallcap, the median number of days to recover is 300+ trading days (roughly 1.5 calendar years).
It is equally interesting that bottom half of largecap (Nifty Jr) behave similar to midcaps, compared to top of largecaps (Nifty). Maybe emergence of new pools of capital (allocation from EPFO/NPS etc) to products like Nifty ETF have helped reduce extent of drawdowns on a relative basis, or it is equally plausible that last few years experiences were just an aberration – only time will tell!
Either ways, ATH is just a stat! An investor’s approach is better advised on goals and their investment horizon, along with their savings rate– these are more under their control, than fretting over 1 day of ATH (among many) as to be sole determinant of whether to invest or not!


