

"Markets bahut volatile hein" - Volatility and its many nuances

“Markets bahut volatile hein”…
“Volatility” is a unique Indian market lingo - I am not aware of any other market, where “volatility” is referred to as such by market participants as in India. In India, it stands for corrections/crash etc, many a time, Indian TV channels while describing markets on a particular day which goes up and down (even a 50 point move in Nifty) also as “volatile” markets.
However, volatility in its universal sense refers to moves away from trend – a degree of variation in price. The moves away from trend can be both up or down. While returns of any asset class are analysed in great depth, volatility analysis is given a passing mention – more like a distraction in the journey.
However, there are many nuances of long term volatility that can help make informed decisions. We unpack some of the nuances in this article here.
We analyse long term trends of volatility of business profits as well as volatility of marketcap (proxy of prices). Volatility in market cap is a perception of volatility of business profits. Thus, while earnings itself may fluctuate against a trend, the perception of this volatility is seen in volatility of prices/market cap. Perceptions are fickle, as they say – sometimes you are the bird, sometime the statue. Hence, volatility cycles of earnings may differ significantly from volatility cycles of prices. Generally, volatility of prices (i.e perception) will be higher than actual volatility of business (earnings)
We live in a “VUCA” world – a world filled with volatility, uncertainty, complexity and ambiguity. Disruptions are rife in every sector – some companies adopting innovation and building strong moats emerge as winners in sectors, while there are countless others displaced from their perch. From an Indian perspective, new regulations and reforms like IBC, GST, RERA, demonetisation, lockdowns have acted as exogenous variables further adding to business complexity. Thus it is fair to assume business operations continue to be volatile, despite the best of plans.
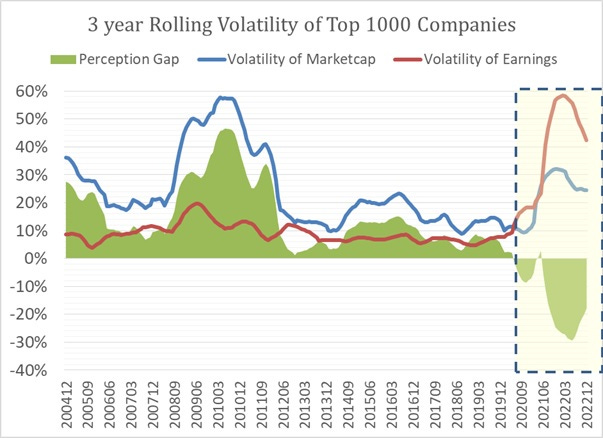
For the Top 1000 companies (at any point in time over last 20+ years), plotted the 3 year rolling volatility of Trailing 12 months earnings and market cap (on a quarterly basis), as well as difference of volatility of market cap over earnings (loosely defined as “perception gap”). The shaded region is post-Covid period, where obviously there was significant increase in volatility. But it is impressive to see how even as there has been no change in volatility of earnings range from 2000 to 2019, the “perception gap” reduced significantly especially from 2016 to 2019. Even on absolute levels, volatility of market cap had gone down significantly post GFC – for eg: the high of volatility in market cap in 2009 to 2019 is almost similar to lows seen in 2000 to 2009 period!
Having looked at broader trends of Top 1000 companies, can quickly look for largecap (Top 100), midcap (101-250) and smallcap (251 – 500) companies. Given the significant loss pools that came through in midcap and smallcap, we look at the same analysis for profitable companies only.
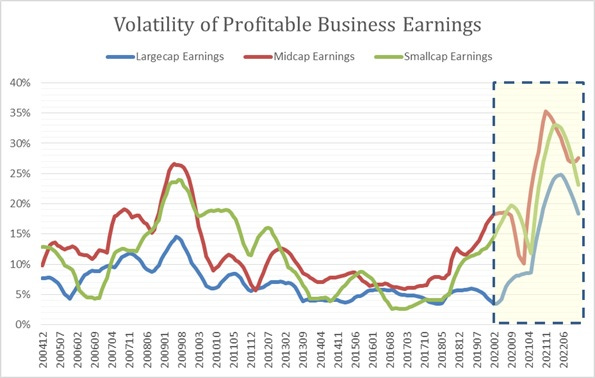
For profitable largecaps, business volatility has come down for most of last decade, lower than lows seen in 2001-10. For profitable midcaps, a similar trend held true till 2016, post which business volatility has been on rise (even before covid lockdowns). For profitable smallcaps, broadly similar trend holds, that volatility which was low from 2010 to 2016 started rising from 2017-20 (before Covid lockdowns). However, it is puzzling that volatility of earnings of profitable smallcaps were lower than those of profitable midcaps. Maybe that is due to fact that very few businesses in smallcap were profitable (and those that could remain profitable during those period) tended to have better defensive earnings streams.
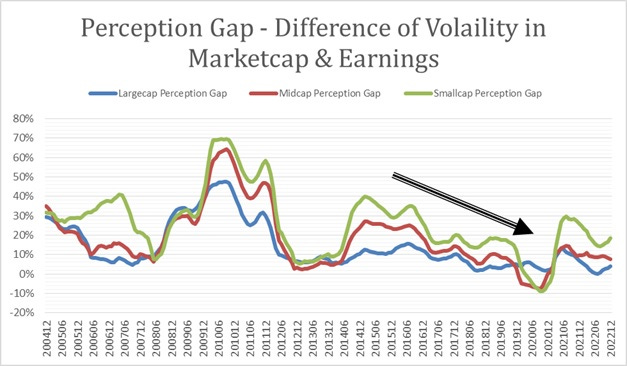
Now plotting the “perception gap” – ie difference in volatility of market cap and volatility of earnings reveals that perception gap has trended down.
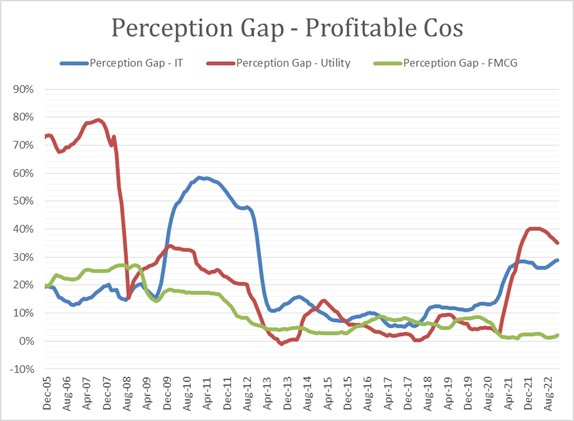
One can peel the onion one layer below as well into sectors as well. While I won’t go into all sectors here, one interesting contrast that caught my eye is business volatility of sectors which are one of lowest in India – FMCG, Utility and IT sector.
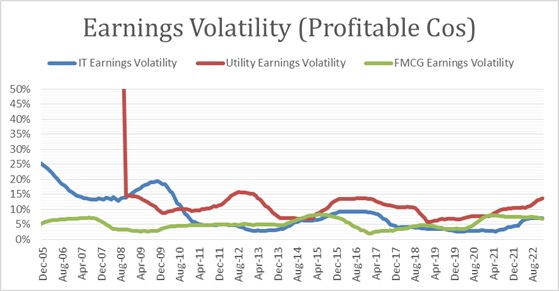
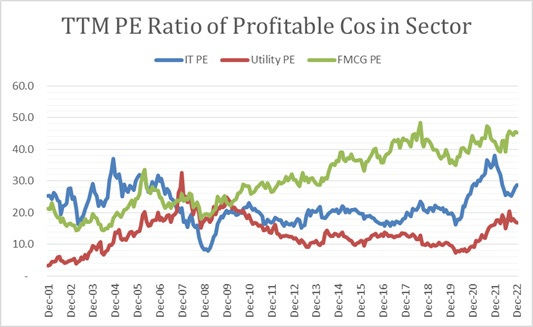
Basis the earnings volatility, IT sector has earnings volatility similar or lower than even FMCG companies. Yet, it has always befuddled me, as to why IT sector result create so much volatility in their stock prices. A 0.5% beat or miss is treated to wild swing, even in larger IT stocks which during 2016-19 were trading at single digit multiples, while misses of 5-10% in FMCG (some trading at 50-60x trailing multiples) were quietly viewed by market as just an aberration. Maybe it is a belief system from past experiences of high growth & business volatility seen pre GFC, which has persisted till now for Indian IT Services
.
There are many reasons for volatility of prices to deviate from business earnings – maybe it is belief of different macro environment (lower interest rates/lower illiquidity premium/emergence of new pool of capitals with differing risk-return alternatives etc). Many of these can continue for decades, while some of them can reverse. However, to blindly believe some segments of market are “low volatility” basis experience of last decade may be erroneous.
Volatility is like a coiled spring – the more it deviates from the underlying, the greater the potential that some of today’s “low volatility champions” will surprise on these expectations in the years ahead.
That's a really insightful take on the relationship between earnings volatility and market Cap.