Mind the GAP...!
Why exponential GDP growth and marketcap accretion do not always create returns for investors?
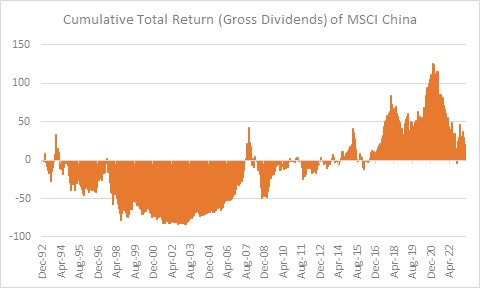
There was a sense of bewilderment amongst many market participants and observers, when reports flashed that cumulative total returns (including dividends) of MSCI China over a 30 year period was ZERO!!!
After all, this was the country that had achieved an economic miracle, growing its GDP more than 25 times during this period. How can returns be so abysmal amidst all this economic growth?
Some may dismiss this as capitalism with Chinese characteristics. And while there may be some truth to it (as multiples have got de-rated post the regulatory crackdown across multiple sectors), is there more to it than meets the eye?
Consider this, for the same index, if one plots the market cap of constituents of index components and the Chinese GDP, we do see that all these economic growth is not entirely wasted on the marketcap of index constituents. Infact from 1995, marketcap of MSCI China has surged by close to 5000 times, even as GDP has grown by 24 times.
Value accretion of companies over time generally translates to returns to investors, but many a time, difference is so stark that almost all phenomenal gains in market cap of underlying doesn’t translate to investor returns – even in a simple buy and hold strategy of investing in an index. So the question that arises, is why is the marketcap growth not translating to equity returns for the unitholders of the index?
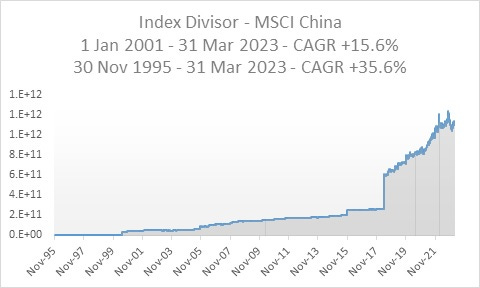
This huge divergence can be explained by constant equity dilution to fund growth, which dilutes existing shareholders as well as constant changes in index composition (especially by changing rules of making an index or frequent churn). A way to look at these is to see how “index divisors” move with time. Index divisors normalize index values for corporate action, equity raise, change in index constituents etc and can be arrived at by dividing the total market capitalization of index divided by index value.
So, if we plot index divisor for MSCI China, we get a whopping 36% CAGR in index divisor for 1995 to 2023! A 36% increase in index divisor – reflecting constant equity dilution as well as churn in index constituents! No doubt, returns to existing unit-holders of index were missing with such a huge rise in index divisor!
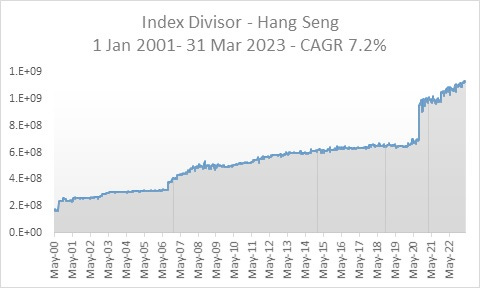
In any fast growing economy, where large portions of unlisted companies come to list as well as if companies grow faster than their internal accruals, they become reliant on equity issuances and thus index divisor tends to rise significantly. But sometimes, the issue lies with change in index rules as well. Case in point, being Hang Seng which in 2020/21 made some significant changes in methodology. Some of the changes were:
1. Increase constituents to 100 (from 55)
2. Select constituents from seven industry groups
3. Shorten listing history requirements (to 3 months) – this was primarily to facilitate tech listings, which were the fad in 2020/21.
4. About 20-25 companies to represent Hong Kong, with balance from mainland China
While many of these changes proposed were with noble intentions, this lead to massive increase in index divisor(look at the vertical rise in index divisor in 2020) Unfortunately, immediately after their inclusion into indices, regulatory action on many tech companies in China further worsened the impact.
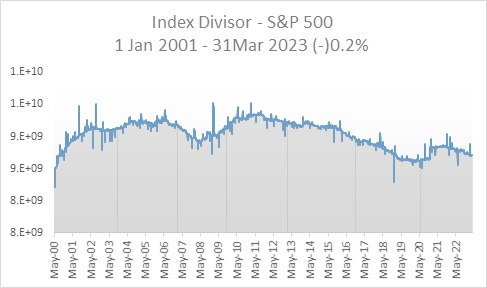
Do index divisors always rise? Let’s look at evidence of developed markets like US and Japan.
US in this millennium has seen negative CAGR growth in index divisor, a function that buybacks are outnumbering equity dilution.
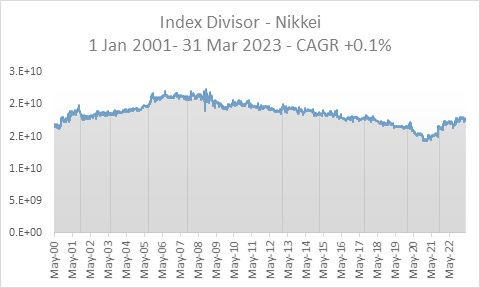
Similarly, for Japan, the index divisor is broadly flat over the last 22+ years
Now that we have looked at global indices, let’s turn towards Indian indices. Since many of Indian indices started recently, starting dates may vary.
Firstly, NSE500 index divisor has seen a index divisor rise of 4.5% over last 20+ years
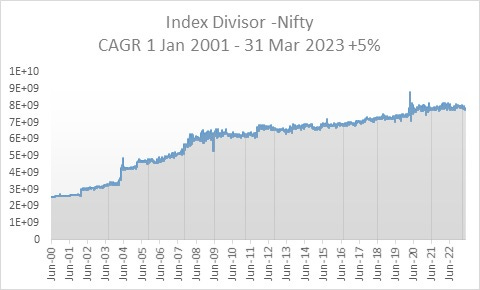
Nifty has seen a similar 5% rise in index divisor over the last 20+ years
For Nifty Junior, the rise in index divisor is 5.1% CAGR over last 15 years
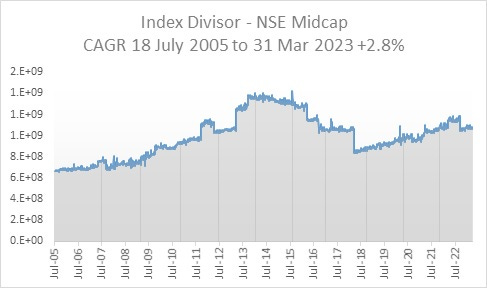
For NSE Midcap, the rise in index divisor is 2.8% CAGR over the last 17+ years
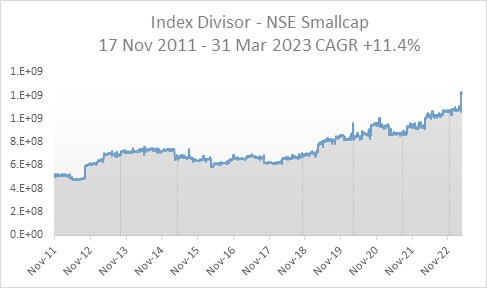
But when it comes to smallcaps, we see a index divisor rising by 11.4% CAGR over last 12 years
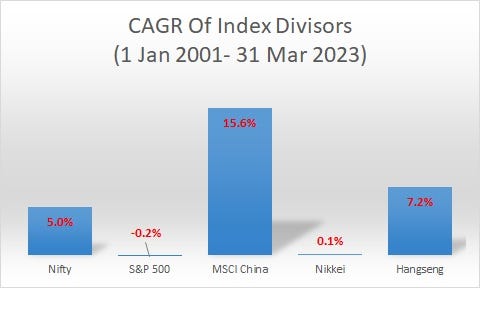
Given that all indices have different starting dates and to make comparison meaningful, the below table compiles the index divisor CAGR from 1 Jan 2001 for global indices along with Nifty
Clearly, the scale of rise in index divisor seen in China has meant that existing shareholders have been diluted in their returns significantly. In some cases, this has been further compounded by frequent changes in index constituents as well as methodologies.
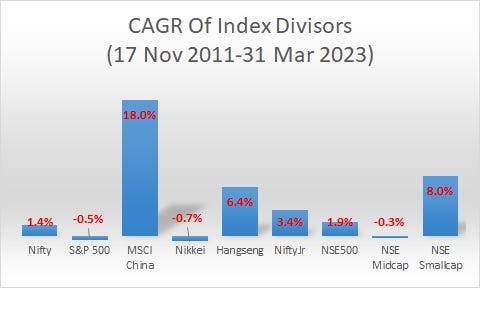
To make comparison with other Indian indices meaningful, compiled the table from 17 Nov 2011 onwards
.
Both S&P500 (US) and Nikkei (Japan) continue with negative growth in index divisors during this period. NSE Midcap also has seen negative growth in index divisor. And while MSCI China is the worst, NSE Smallcap has also seen significant growth in index divisor. Amongst larger cap indices, Nifty Junior has seen a relatively higher growth in index divisor.
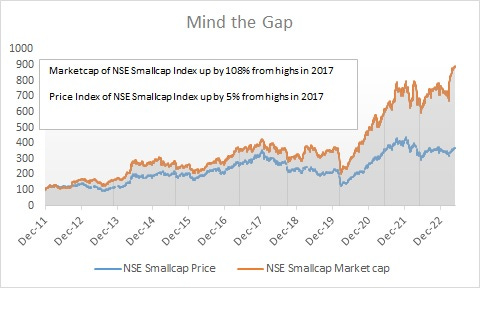
Thus, what has been seen in the case of China, has been seen in case of NSE Smallcap index (albeit to a lesser extent), where marketcap of index components is up by more than 100% from 2017 highs, while index value is up by only 5% since then. In this case, it was significant change in methodology (possibly lead by SEBI categorization in 2018), which saw 163 companies added and deleted in a span of 3 years!
What are the implications of analyzing index divisors?
· Market participants are enamoured by growth. However, not all growth will be rewarded to shareholders, especially if this growth needs to be constantly financed by equity dilution.
· Over the last decade, barring financials which raised significant equity in Indian markets, equity raise by rest of sectors were low, as growth was low and most companies were consolidating from their expansion plans seen in the pre GFC era. Now with balance sheet of India Inc in order, many companies will go for expansion, which may need to be financed with equity raise. So there is a good chance that index divisors in India in coming decade will be higher than seen in last decade. Also, given that significant portion of India Inc is unlisted, we are likely to see increase in index divisor in that count too. Do note the significant FDI that went into start-up world/private equity will all need to exit (mostly via public listing) in the coming decade.
· Indices are public goods, and while they serve multiple purposes, one of the key purpose served is to act as a store of wealth of nation. Constant changes in methodology, high churn may result in a compromise of this utility of benchmarks. There are trade-offs in various functions of indices (liquidity, benchmarking, store of wealth, long term asset allocation etc), and one may need to prioritize some aspects over another. If one focuses on catering to fad of moment (like Hang Seng episode), it may lead to counter-productive outcomes.
· As an allocator, it is important to be mindful of these long term trends, as they can have a meaningful impact of net investor returns, even in a simple buy and hold strategy like investing in an index.
Mind the “potential” gap that may arise over long term!





Hi Harish, Very Insightful analysis
Hi Harish, Good and insightful analysis!