

Super-compounders - A study on some extra-ordinary companies listed in India

Super-compounders – A Study on extra-ordinary companies listed in India
Harish Krishnan, CFA
There are many studies globally how Indian stocks have seen some of maximum number of multi-baggers in last decade. For example, one study titled “Global Outperformers” by Dede Eyesan of Jenga Investment Partners looked at period of May 2012-May 2022 at global universe of companies with a market capitalisation of atleast 500mn$ (a total of 14090 companies). There were 446 companies globally, which returned 1000% during this period, of which 91 companies were from India. USA came second with 60, followed by Japan at 49 companies.
While Indian companies have showcased tremendous wealth creation opportunities over the last many decades, I analyse in particular a special cohort of companies from business fundamentals point of view – I term as “Super-Compounders”. I have been fascinated by companies that scale up significantly – so much so, that sales of today is profits a few years down the line.
There are 3 reasons to look at investment probabilities through the lens of “Super-compounders”
1. Most business houses (especially in India) tend to look at their top-lines as the metric that defines their corporate identity, especially when unlisted. With many qualifying contracts/bragging rights linked to top-line, most companies typically tend to scale their revenues first, often compromising profits and more so, cash flows. Thus, when a company brings discipline in its capital allocation and working capital, focusing on higher margins and capital efficiency – is a tough ask that very few companies manage to accomplish.
2. Traditional measure of profit compounding (say number of companies that compound earnings by 20% CAGR or 30% CAGR etc) – don’t take into account the starting size of company. For eg, there were many companies with very low profits, and so point to point CAGR of earnings sometimes gives a very high number of companies that go past a hurdle of 20%/30% CAGR across decades etc.
3. Thirdly, over the last 20+ years, India GDP has grown by 10+ times. To maintain their relevance in growing pie, company’s toplines also tend to increase. Thus, for profits in subsequent years to match (a growing) topline requires significant discipline, making it tougher for companies to be present in such a list. This is like running a marathon on a hill – unlike a treadmill – testing endurance of companies.
We look at Top 500 companies each year (ex-financials) from 2000 till 2022, and see how many companies end up being super-compounders. So, for example, we start in say 2007 sales of all these companies, check if their profit in 2008 is higher than 2007 sales (highly unlikely), check the same in 2009, 2010 all the way upto 2022. (Similarly, we do for all years from 2000 till 2022). Sometimes, few companies profit may zoom up due to asset sale (which is one-off in nature). Similarly, few companies may report profits at 100% of past sales, in subsequent years may drop off to 95% of past sales etc. To smoothen both these, we look at rolling 5 years period, in which a company that has profits which were sales in past for atleast 3 years – these make the cut to be called as “Super-compounders”
Having got the methodology out of the way, let us look at base rate for a company to be a “super-compounder”. As one would imagine, “super-compounders” are a rare species – these are truly extra-ordinary accomplishments by visionaries managing these companies.
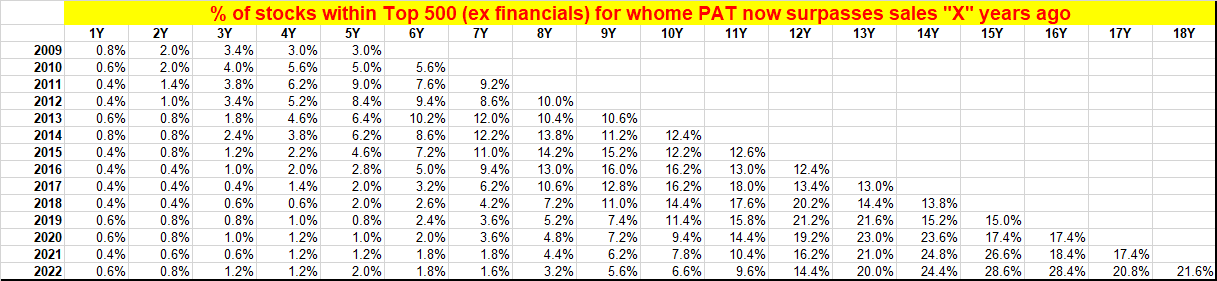
So, let us explore the table in greater detail, say for 2022. Any company whose profits in 2022 were the sales in 2021/2020/2019 and even 2018 are more likely to be huge cyclical companies, where commodity prices were significantly impacted in base year and as prices reflated, it all flew through earnings. While, obviously these can generate significant stock returns, I would prefer to ignore those companies – as timing of when commodity prices reflate is extremely difficult. As it is, close to 1% of all companies (in 2022) fall under that basket. As we look at 5 years and beyond, we conclude that 2% of all companies emerge as “super-compounders”, and as one looks at 10 years (ie profits in 2022 are more than sales in 2012) – the base rate moves to 6.6% - about 30 companies! As one goes back to 18 years ago (so base year 2004) – the base rate jumps to 21.6% - close to 100 companies.
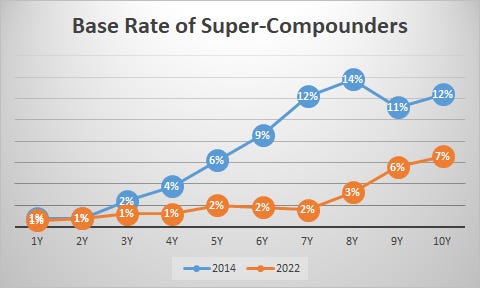
If we look at base rate over time and plot the 2014 cohort to 2022 cohort, we get a sense that base rates are declining with time. So for example, in 2014, almost 10% of companies had profits higher than sales 6 years ago (and was in list of minimum 3 out of 5 years prior), while in 2022, only 2% made the cut of having profit larger than sales 6 years back.
Fewer and fewer companies are in this “elite” league of super-compounders. The number of companies with topline more than 1000crores in March 2003 were 80 companies, today that number stands at 900 companies(of all listed companies in India). Larger topline size does make the follow-up act (of profits more than growing topline few years down the line) – more difficult, but the last few years also had a difficult macro backdrop.
Having seen the base rates, let us see the sectors that dominate the “super-compounder” lists. There are in total 251 super-compounders that have appeared atleast once in the period from 2010 to 2022. Many of them appear only once, but few sustain for many, many years. There are only 32 companies which have been present atleast 50% of time in the list from 2010-2022!
Plotting the sectors where super-compounders have appeared from 2010-2022 (weighted by the number of times, each of these companies have qualified as super-compounders over last 22 years) reveals 4 broad sectors – materials (especially chemicals as well “niche” materials like tubes, pipes etc), pharmaceuticals, IT (GICS classifies some IT companies in Commercial & Professional Services as well), capital goods. Besides this, auto (especially ancillaries), consumer durables & apparel and utilities (especially gas utilities) also have seen reasonable presence of super-compounders. PSU also have a reasonable representation (especially mining companies/utilities).
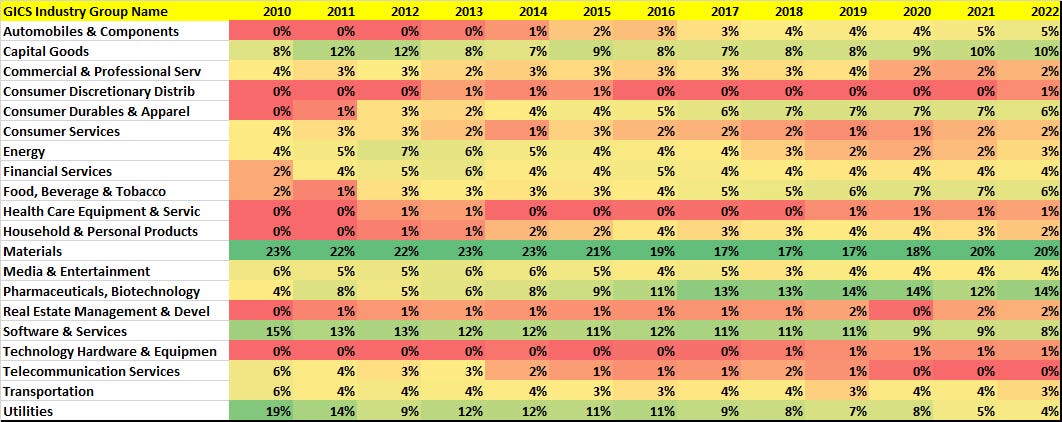
While there are some sectors where the distribution of super-compounders is more pronounced than others, they are present across boring sectors too. In almost every industry, there are exceptional companies that pursue a disciplined pathway to grow their company, gaining mindshare and market share, but more importantly maintaining or improving already high capital efficiency ratios and operating metrics. Sectors that are otherwise perceived as boring and sedate – pipes, consumer durables, gas utilities, industrials, auto ancillaries – it is not that they have chartered new business models or used cutting edge technologies in their products/services – but they have used differentiated processes to further their gains and make their mark.
Within this cohort of super-compounders, there are some companies which have executed superbly without raising external equity capital during this journey. There are 87 companies (out of 251 companies which were part of the list atleast once from 2010 to 2022) where free float is less than 30%! (High promoter holding is a proxy that companies have generally internally funded their growth plans). Even within this rarefied set of super-compounders, these internally funded growth engines are truly the “best-of-breed” – having formidable capital allocation skills and operational finesse, while maximising shareholder wealth over the long run!
Markets have rewarded well these cohort of companies in general. A median stock of the super-compounder cohort of 2022, for example has seen an outperformance of 10%+ annualised (over 5-10+ years) Of course, not all of these 251 companies have been rewarded by markets in recent past. Many companies that were once super-compounders may have lost their way, for example of 251 super-compounders, 61 have given negative last 5 year returns and 132 have under-performed NSE500TR in last 5 years. As many as 51 companies (amongst these 251 companies) have a trailing P/E ratio higher than 50x, while 52 companies have a trailing P/E ratio less than 15x. The limited point being, even these extra-ordinary companies under-perform over reasonably long stretches of time, and perception of these companies swings from extreme adulation to believing the best is behind!
All companies (super-compounders or otherwise) go through cycles – during times of sector headwinds are where these super-compounders make the maximum gains and pull away from rest of sector, from a business point of view. It could be manifested in higher share of capex within a sector, or increasing market/mind-shares, or investment in new IP/processes – even as other attributes like earnings growth etc remain lacklustre (due to sector headwinds). Backing these companies during such sector headwinds and riding on their coat-tails over the next many years can be a very rewarding experience!
Here is to uncovering and investing in more such extra-ordinary businesses – the incredible SUPER-COMPOUNDERS in the making!
very insightful statistical analysis, would love to see how P/E (or market perception rather) has manifested for these companies (either the primary 32 or the extremes of >50 and <15) over the period.
any specific examples for the last para (higher capex during headwinds leading to market gains)?
thanks for sharing
Hi Harish, really interesting analysis! Thanks for sharing this. :)
If you haven't already come across this, there's an interesting post by the folks at Capitalminds:
https://www.capitalmind.in/2022/09/where-do-superhero-stocks-come-from/
I thought this might be of interest to you.