“The season of failure is the best time for sowing the seeds of success and the seeds of destruction are sown in good times!!!”
Any seasoned market participant will confirm to this adage – in bad times, relentless focus, discipline helps in steadying the ship to eventually make the best when headwinds recede. Similarly, when everything is good, complacency, new experiments & distractions – all destroy longer term value!
Post Global Financial Crisis in 2008, India Inc had seen a significant repair of its balance sheet, as many of their bets made pre GFC went awry. With changes in regulations (IBC), promoters were at risk of losing their companies, should they default on the loans. The number of companies that were loss making went up significantly.
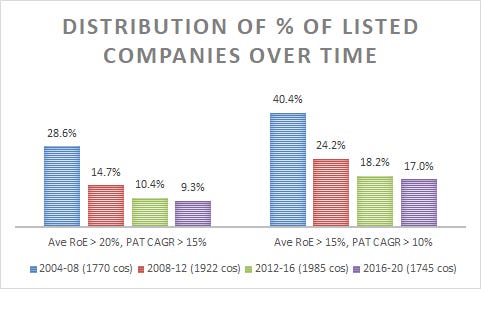
The decade of 2010-2020 thus was an era of frugality, companies with prudent management focused on improving the balance sheet of their companies, trying to improve their return ratios and other operational metrics. Even as the number of companies reporting 15%+profits and 20%+average RoE (or 10% PAT CAGR with 15% average RoE) diminished, the companies that achieved growth with high capital efficiency got rewarded significantly by market participants.
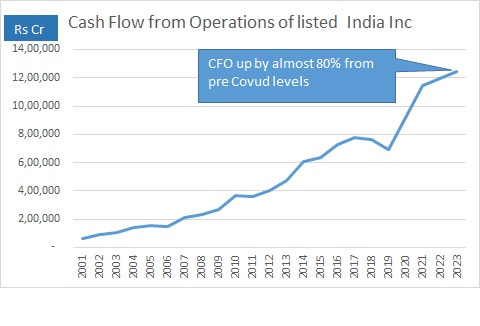
And now, the tide has turned. This is possibly best reflected in cash flow from operations that listed India Inc (ex-financial) are now churning compared to pre-covid levels. Cash flow from operations of listed India Inc have almost gone up by 80% from pre-covid run-rates. With economic activity improving post pandemic shocks, this number shall further improve in the years to come.
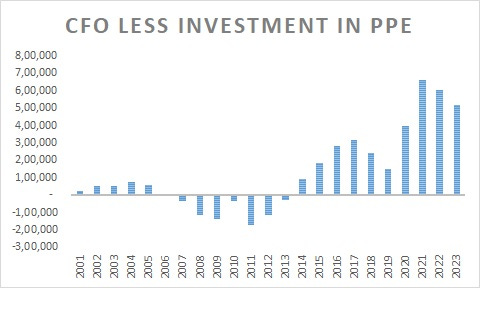
It is in this bountiful environment that captains of industry have to now re-invest these growing cash flows into. Companies can choose to invest in Plant, Property & Equipment (PPE), invest in group companies or do mergers & acquisition – from the cash flows emanating from operations. The excess of CFO post investing in PPE has now ballooned to around 6 lakh crores on an annual basis, from 1 lakh crore in 2019.
Many companies were doing maintenance capex, not necessarily growth capex as asset turns dipped in the last decade. Now, as cash flow from operations have surged, capex has also started inching up. Total capex of listed India Inc crossed 7 lakh crores for first time in 2023 (for almost the entire decade of 2011-2020, capex was oscillating in the band of 5 to 7 lakh crores). The gap between cash flow from operations and capex is expanding significantly. The 2000s also witnessed this, leading to a significant rise in capex. This was helped by global tailwinds, with huge spike in commodity prices, making payback of incremental capex extremely lucrative.
While dividends and buybacks have gone up, especially in IT Services industry, other sectors haven’t meaningfully increased return of capital to shareholders. This leads to prospects that one may see an increase in M&A.
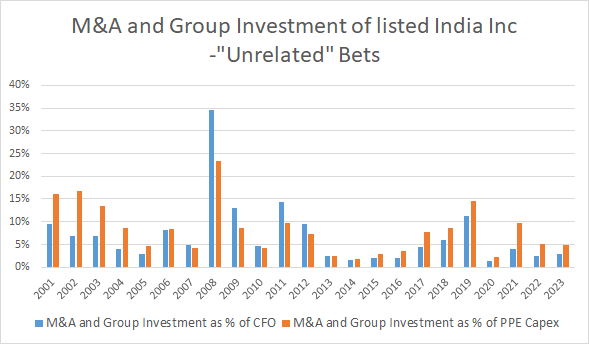
M&A trends (along with investment in group firms) – termed as “unrelated” bets as percent of overall capex has generally been in low single digits. In the peak of 2002-08 cycle, this number moved to almost a fifth of overall capex. For now, these “unrelated” bets are still a minor portion of CFO and PPE capex, however, large piles of cash is an itch that can tempt many a corporate chief. While not all M&A is bad, generally the track record of companies doing value accretive acquisitions have been limited. Thus, we have seen markets punishing announcement of acquisitions recently.
Maybe this is too early in the cycle to worry about small acquisitions, but it will be worthwhile if CXO prioritise re-investment in their existing businesses to provide much needed growth capex, before committing large M&A. While markets reward growth – especially in the near-term, growth coming from sub-optimal capital allocation decisions will have a longer-term negative bearing.
Many countries with abundant natural resources have squandered these advantages by focusing on the short term – termed as the resource curse. Many companies of India Inc have generally operated in an “era of frugality” – given scarcity of risk capital, competent management teams and long-term orientation of promoter-owners have generally viewed equity capital as a precious commodity that shouldn’t be squandered away, chasing the latest fad. It will be interesting to see if these principles hold true in an “era of abundance” that we seem to be heading towards. Apart from “excess” cash flow from operations of 6 lakh crores per annum, there is adequate capacity of banks to lend. Foreign capital also seems to be coming in droves – wanting a slice of the huge multi-decadal growth opportunity. It is thus, truly a “problem of plenty” that India Inc has to carefully weigh its investment decisions – focusing on long-term shareholder accretive growth!
After all, the goal is to steer the ship in right direction, not necessarily catch the fastest wind!


Thnx
CFO is not X + Y....as CFO can be used multiple ways as well , infact can be lesser than overall Capex as well (as was case in 2008). The graph plots unrelated bets as percent of CFO as well as enterprise value (aggregate). Hope it clarifies
Hello there,
Huge Respect for your work!
New here. No huge reader base Yet.
But the work has waited long to be spoken.
Its truths have roots older than this platform.
My Sub-stack Purpose
To seed, build, and nurture timeless, intangible human capitals — such as resilience, trust, truth, evolution, fulfilment, quality, peace, patience, discipline, relationships and conviction — in order to elevate human judgment, deepen relationships, and restore sacred trusteeship and stewardship of long-term firm value across generations.
A refreshing take on our business world and capitalism.
A reflection on why today’s capital architectures—PE, VC, Hedge funds, SPAC, Alt funds, Rollups—mostly fail to build and nuture what time can trust.
“Built to Be Left.”
A quiet anatomy of extraction, abandonment, and the collapse of stewardship.
"Principal-Agent Risk is not a flaw in the system.
It is the system’s operating principle”
Experience first. Return if it speaks to you.
- The Silent Treasury
https://tinyurl.com/48m97w5e